Wedeforex -Signal Forex Gratis Dan Indikator-

Blog Wedeforex Bertujuan Untuk Membantu para Trader Meraih Keuntungan Di Dunia Forex. Wedeforex Blog Menyediakan Signal Forex Gratis, Sistem Trading Forex Dan Indikator Forex Gratis

"

Tuesday, May 14, 2019

Buy GBPUSD 14 May 2019


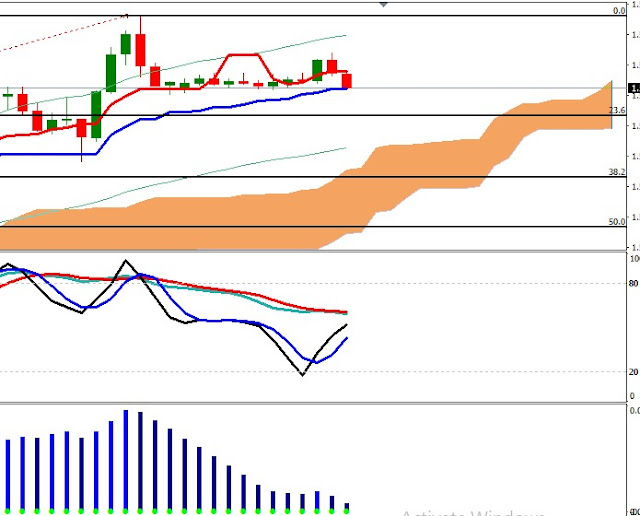
BUY GBPUSD at level 1.29500
STOP LOSS GBPUSD dilevel 1.29130
TAKE PROFIT GBPUSD di level 1.29860

Friday, December 21, 2018

Signal EURCAD 21 December 2018


Sell EURCAD di level 1.54498
Stop Loss EURCAD dilevel 1.55391
Target profit  EURCAD di level 1.53600

Thursday, December 20, 2018

Signal EURCAD 20 December 2018


Pending Order Sell EURCAD di level 1.53815
Stop Loss EURCAD dilevel 1.54521
Target profit  EURCAD di level 1.53133

Wednesday, December 19, 2018

Signal EURCHF 20 December 2018


Pending Order Sell EURCHF di level 1.13185
Stop Loss EURCHF dilevel 1.13431
Target profit 1 EURCHF di level 1.13036
Target profit 2 EURCHF di level 1.12926

Signal GBPCAD 19 December 2018


Pending Order Sell GBPCAD di level 1.70055
Stop Loss GBPCAD dilevel 1.70782
Target profit 1 GBPCAD di level 1.69605
Target profit 2 GBPCAD di level 1.69218

Tuesday, December 18, 2018

Signal GBPUSD 18 December 2018


Pending Order Sell GBPUSD di level 1.26501
Stop Loss GBPUSD dilevel 1.27031
Target profit 1 GBPUSD di level 1.26195
Target profit 2 GBPUSD di level 1.25972

Signal EURCAD 18 December 2018


Pending Order Sell EURCAD di level 1.52209
Stop Loss EURCAD dilevel 1.52859
Target profit  EURCAD di level 1.51851

Signal GBPCAD 18 December 2018

Pending Order Sell GBPCAD di level 1.69055
Stop Loss GBPCAD dilevel 1.69689
Target profit 1 GBPCAD di level 1.68673
Target profit 2 GBPCAD di level 1.68455

Tuesday, November 6, 2018

ATB Sniper Indicator


The ATB is designed to save you more time than you ever could have imagined…

So let’s use the same time example as above, but now instead if doing it manually you throw on our ATB Sniper Indicator.

Say you have been trading with the ATB Sniper that required no drawing but simply just adding it to your charts for the next five years...

According to our calculations you will spend a total of 1 minute and 30 seconds drawing, redrawing, deleting, etc. Triangle patterns on your charts.

Meaning that the only time it took for you to do all these tasks was implementing the indicator on to your charts!


Signal GBPUSD 06 November 2018


Rekomendasi Trading

Pending Order Sell GBPUSD di level 1.30407
Stop Loss GBPUSD dilevel 1.30727
Target profit 1 GBPUSD di level 1.30087
Target profit 2 GBPUSD di level 1.29289

Signal GBPCHF 06 November 2018


Rekomendasi Trading

Pending Order Sell GBPCHF di level 1.31063
Stop Loss GBPCHF dilevel 1.31543
Target profit 1 GBPCHF di level 1.30754
Target profit 2 GBPCHF di level 1.30615

Sunday, November 4, 2018

Signal GBPCHF 05 November 2018


Rekomendasi Trading

Pending Order Sell GBPCHF di level 1.30351
Stop Loss GBPCHF dilevel 1.30751
Target profit 1 GBPCHF di level 1.29948
Target profit 2 GBPCHF di level 1.29518

Tuesday, July 31, 2018

MAGIC BREAKOUTPLUS

Why MagicBreakout?
● Enter the market before the crowd. With this strategy you will be able to predict breakouts before the momentum traders arrive.
● MagicBreakout is a conservative trading strategy It's safe. You risk a small amount of money on every trade.
● Mechanical. Trade by following a set of simple rules.
● Easy to implement. Convince yourself that trading is really easy!
● Profitable. If you stick to the rules and go through a series of losing trades, you will finally become profitable.
● Scalable. Our MagicBreakout strategy has become a key of the top traders. An improved MagicBreakout+ strategy can make +67% in one month. Our student made 5400% in one year using his own exit rules.

What is really a “breakout”?
A breakout happens when the price breaks a significant high and makes a new high. This is the definition. Let's give an example
Another breakout happens when the price breaks a significant low and makes a new low.

It looks simple. Most traders are trying to catch these breakouts and make money on the accelerated price move. A so-called momentum trader places his buy-stop order just above the significant high. He is waiting for this high breakout... If there is no breakout, he cancels his buy-stop order and prepares for the next trade. If the breakout happens and his buy-stop target is filled, his trading platform automatically opens a long position. The same holds for a low breakout (in that case, trader would place a sell-stop order). Why traders are doing that? Because the price action typically accelerates after a breakout and results in a nice profit. But it's not so sweet every time. There is a risk of significant loss. The nightmares of momentum traders are “false breakouts” and they happen too often. Let's explain why.

The secret behind false breakouts 
Let's discuss the false high-breakouts (the same holds for low-breakouts). There are times when price breaks a significant high, a buy order is filled, long position is opened, but the price quickly turns back down and never comes up or Stop Loss is filled. The trader has to exit position with a loss. Small losses are not something unusual. Every professional trader has losses in Forex trading, you have to admit it. But a profitable trader wins more than loses after time. We have tested some breakout systems on all major currency pairs ten years back. Most of the breakouts were false breakouts or resulted in a small profit. Any system that relies purely on breakouts does not work consistently. Since we, Tim and Julie, are in the financial markets for more than ten years, we have collected some sort of information the large banks and corporations do not want you to know. A large bank has enough money to move the market for a while. When the price hits the significant high again, it should normally bounce back from this high forming a double top pattern. But momentum traders would go long when a breakout happens - it is the well known practice explained in previous paragraph. When the price comes close enough to the high, traders inside the bank quickly buy a large volume of one currency pair ($ millions!). They move the market a few pips up and a forced breakout happens! There is a bunch of buy-orders lying just above the high and these orders get filled immediately. Then the market moves some additional pips up because of the new long positions. After that the bank happily closes its own large position (sells the millions back) and the price quickly turns back. The banks “earn” great amount of money doing this unfair business. They do it a few times every day...

Julie comes with a genial solution: Enter the breakout before the crowd! 
Julie experimented with the CCI indicator (Commodity Channel Index) in the Forex market years ago. There are two common lines: +100 line and -100 line on the indicator chart. When CCI crosses (or “breaks”) the 100 line upward, it is a good entry signal to go long. When CCI crosses (or “breaks”) the -100 line downward, it is a good entry signal to go short. Good signal means that the probability of winning dramatically increases. In other words – CCI indicator acts like a filter for spotting winning trades. Not only a filter. It gives an opportunity to enter the market before a breakout! There was a hard work in developing a definite profitable strategy based on this knowledge. Our strategy is easy to use and gives impressive results. With our students, we made a fortune in the years 2006 and 2007 starting with less than one thousand dollars. We will give our knowledge to you in the next chapters.


Monday, July 23, 2018

Pips Winner Indicator

How It works ? Trading Rules
 You Sell when color turns from green to red
 You buy when color turns from red to green
 You can use alerts (sound+email), just enable them on the indicator settings


Sure Forex System

The Sure Forex System is based on the idea that a GBPUSD will fluctuate Within a particular range and the range will vary according to routine pressures. By using the Sure Forex System you will assess this range and take Advantage when the currency pair breaks out of the base line range.

Sure Forex System Step by Step: First set up your chart. This the same process every day and only takes a few minutes
1. Open a 15 min Chart for a GBP/USD
2. Draw a vertical line at 04:00gmt time on your GBP/USD Chart.
3. Draw a vertical line at 06:00gmt time on your GBP/USD Chart. Please note the charts shown here are on FXDD which is GMT+2. So the lines appear on the chart at 06:00 and 08:00
4. Draw a Horizontal line at the high of candles/bars in between the vertical line.
5. Draw a Horizontal line at the Low of candles/bars in between the vertical line.
6. Add a 89 ema (exponential moving average) to the chart

This is what your screen should look like
Notice the red lines form a box. The 89 ema is blue.

At 06:15 GMT Look at your chart. There are three possible outcomes 

No Trade 

If the 89 ema crosses the box DO NOT TRADE. Simply wait for the next day. See example Below

Sell Trade 

If the 89 ema (the blue line) is ABOVE the box place a pending sell order (sellstop) 5 pips BELOW the bottom line of the box. Set your stop loss at 20 pips and your take profit at 75 pips. Set a 45 pip Trailing Stop. When you are 20 pips in profit move your stop to break even. See example below 


 In this example the LOWER red line of the box is at 1.6081.
 We placed our pending sell order 5 pips BELOW it at 1.6076.
 Our stop loss was placed 20 pips above our pending sell order at 1.6096. 
 Our take profit was placed 75 pips below our pending sell order at 1.6001. 
 When the trade moved 20 pips in our favor we moved the stop loss to our entry at 1.6076.

Buy Trade 

If the 89 ema (the blue line) is BELOW the box place a pending buy order (buystop) 5 pips ABOVE the top of the box. Set your stop loss at 20 pips and your take profit at 75 pips. Set a 45 pip Trailing Stop When you are 20 pips in profit move you stop to break even. See example below

 In this example the UPPER red line is at 1.6086. 
 We placed our pending buy order 5 pips ABOVE it at 1.6091. 
 Our stop loss was placed 20 pips below our pending buy order at 1.6071. 
 Our take profit was placed 75 pips above our pending buy order at 1.6166. 
 When the trade moved 20 pips in our favor we moved the stop loss to our entry at 1.6091.

IMPORTANT: Once the order is placed let it run until 06:00 GMT the next day.


Thursday, July 19, 2018

Auto Trend Forecaster


Indikator ini adalah indikator yang cara kerjanya sangat simpel yaitu mendeteksi signal berdasarkan warna merah dan biru, ketika indikator berganti warna dari biru ke merah saatnya untuk melakukan Sell dan ketika indikator berganti warna dari merah ke biru saatnya untuk melakukan Buy. Indikator ini juga dapat memberikan peringatan signal melalui Popup Alert Window saat terjadi pergantian warna, semua informasi tertera pada Popup Alert Window (Trend Up / Trend Down, Signal Buy /  Sell, Harga Entri, Tingkat Stop Loss, TimeFrame dimana signal diterima, dan Pair / Mata Uang dimana signal diterima).

Input Parameters:
  • TMperiod (default = 26) — Anda dapat mengubahnya, semakin tinggi nilainya maka semakin akurat signal yang anda dapatkan namun sedikit signal yang dihasilkan, semakin rendah nilainya maka semakin banyak signal palsu yang anda dapatkan namun banyak signal yang dihasilkan. Jadi Berhati-hatilah.
  • Intensity (default = 1.9) — Sebaiknya dibiarkan settingan default, namun jika anda ingin merubahnya ada baiknya dirubah sesuai petunjuk "User Manual" yang sudah saya lampirkan bersamaan dengan indikator ini yang akan anda download nanti.
  • SL_distance_pips (default = 200) — Jarak dari harga entri ke stop-loss, default = 200 (untuk broker 5 digit = 20 pips), jika anda menggunakan broker 4 digit maka bisa anda ubah default = 20 (untuk broker 4 digit = 20 pips).
  • Pengaturan default di optimalkan untuk trading pada timeframe M15 dan M30

Seperti yang bisa anda lihat pada gambar diatas, trading cukup mudah jika anda menggunakan indikator ini, hanya Buy ketika indikator berganti warna dari merah ke biru dan Sell ketika indikator berganti warna dari biru ke merah. Tapi kelemahan dari indikator ini yaitu kurang jelasnya penentuan take-profit dan indikator ini kurang baik digunakan saat pasar sedang Sideway Trend, untuk itu disarankan agar berhati-hati dalam mengatur balance anda dan gunakan Money Management yang baik sehingga anda terhindar dari Margin Call dan trading yang loss tidak akan mempengaruhi emosi anda dalam mengambil keputusan berikutnya.